Generating 3D Smith Charts the Easy Way

Kaelly FarnhamSign in to follow this author
Sign in to follow this author
Marketing Programs Manager at Keysight Technologies
Engineers surround themselves with the best tools they can find. For the RF engineer, a new tool discussed in the literature recently is the Cylindrical 3D Smith Chart (also called the “Smith Tube”). This 3D version of the classical Smith Chart allows engineers to explore data in new and interesting ways. It was pioneered by a team at Baylor University led by Dr. Baylis and presented in a landmark IEEE WAMICON paper in 2014 that introduced the "Smith Tube" in the literature for the very first time (see more references at the end).
The Smith Chart was developed in the 1930’s as a graphical way to transform complex impedances to reflection coefficients. For an unassuming diagram based on slide rules, the Smith Chart is still enormously relevant in the digital age; in fact, most engineers try to fit so much data into this small circle that we end up with more lines, arcs, and circles than we can ever interpret. With access to so much data these days, things can get awfully cluttered. Now, it’s possible to make sense out of more data by adding a third dimension to the classical Smith Chart plot. For example, on the classic Smith Chart, you can visualize how impedance changes versus frequency. On the 3D Smith Chart, you can understand how impedance changes versus frequency AND voltage…or gain…or input power, or anything you can imagine!
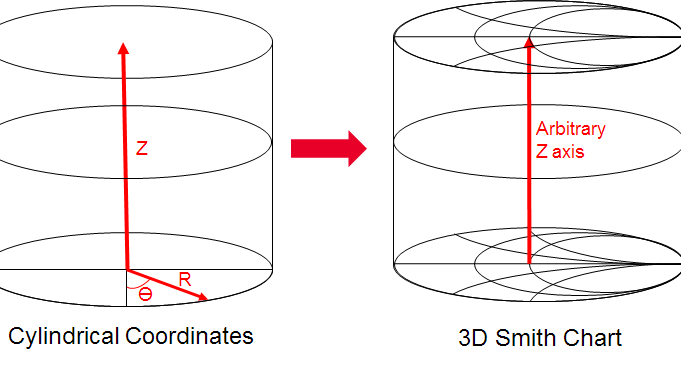
To create a 3D Smith Chart, simply take a standard Smith Chart and stack it on an arbitrary Z-axis (Figure 1). The Z-axis can take on any value or scale you desire, such as frequency, power, or transmission line length. The composite plot is then just a stacked set of Smith Charts with each "slice" representing a single classical Smith Chart for a given Z value.

Figure 1. The 3D Smith Chart is analogous to generating a plot in Cylindrical Coordinates, where a cross-sectional plane is represented in polar form by (r,Ɵ) , and the Z-axis is specified in the standard Cartesian Coordinate system.
3D Smith Charts can be easily created using a Python library which can be set up to plug directly into Keysight ADS, which allows you to access this capability to plot and analyze simulation or measurement data.
How to Set Up Your Own 3D Smith Chart
The first step is to set up the ADS Data Link with Python, which provides a simple way to call a Python script from ADS, complete with bi-directional data transfer. Find out how in the video below. Registered users can also view the application note, ADS Data Link with Python.
ADS Data Link Basics (Part 1 of 3) - YouTube
To use the ADS Data Link with Python, you must first install Python Anaconda (available at no charge), and then load the functions into ADS. The ADS and Python functions needed for this setup are available in the workspaces (for registered users). A Data Display with interactive step-by-step instructions is included in the workspace and will walk you through the setup for your particular machine (Figure 2).

Figure 2. For most ADS users, this simple data display page should be all that’s needed for setup.
Following setup, you can call Python scripts directly from ADS using previously loaded functions. They can be invoked either from Data Display or from Schematic through a MeasEqn component. To execute a Python script and return what the script prints to the command line, use the following ADS equation:

Since Python scripts are typically used to process and/or plot data generated from an ADS simulation, you will also need to pass ADS data into Python and then receive data back into ADS from Python. This can be done using the following equation:
ADS_RtnData=call_python_script_IO(PATH to Directory of Python Script, Python Script Name, Data1, Data2, Data3...,DataN)
The above function exports data from ADS into Python, runs the specified Python script (which can access the data), and automatically exports data back to ADS using the Python script—all in one step. Using this function along with a predefined Python script, you can generate a 3D Smith Chart from ADS and plot simulation data on it. The Python scripts used to generate the 3D Smith Chart are provided in the workspace folder ./Smith_3D_wrk/data/Python, provided for registered users.
Similar 3D Smith Chart plots can be generated from other workspaces. All you have to do is adjust the path string in the function "call_python_script_IO()" to point to the location of the Python folder that has the 3D Smith Chart scripts you are calling.
The above process is ideal if you want to plot points, lines, simple surfaces, and contours using data generated from ADS simulations. If you’re interested in using Python scripting to generate more advanced plots on the 3D Smith Chart; however, then you’ll want to get a better understanding of the Python functions that enable 3D Smith Chart plotting.
Watch this video to see advanced plotting using the ADS Data Python link. Registered users can view the application note, How to Create your own 3D Smith Chart Plots.
Advanced Plotting Using the ADS Data Link (Part 2 of 3) - YouTube
You can see that the 3D Smith Chart offers you unique insights that other standard plotting tools simply cannot, and we've only just begun. Find out so much more in this upcoming live webcast: Four Ways to Boost Simulation Data Processing Using Python.

Registered users can view the following resources in the Keysight EEsof EDA Knowledge Center (register here):
Apply today for your free 30-day full-version trial of Keysight ADS.

References
For more information on the "3D Smith Tube" from the team at Baylor University, see the following IEEE papers:
1. Joseph Barkate ; Matthew Fellows ; Jennifer Barlow ; Charles Baylis ; Robert J. Marks. "The Power Smith Tube: Joint optimization of power amplifier input power and load impedance for power-added efficiency and adjacent-channel power ratio". IEEE Wamicon, 2015. http://ieeexplore.ieee.org/document/7120398/
2. Matthew Fellows ; Matthew Flachsbart ; Jennifer Barlow ; Joseph Barkate ; Charles Baylis ; Lawrence Cohen ; Robert J. Marks. "Optimization of power-amplifier load impedance and waveform bandwidth for real-time reconfigurable radar". IEEE Transactions on Aerospace and Electronic Systems ( Volume: 51, Issue: 3, July 2015 ). http://ieeexplore.ieee.org/abstract/document/6857780
3. Matthew Fellows, Sarvin Rezayat,Jennifer Barlow, Joseph Barkate, Alexander Tsatsoulas,Charles Baylis,Lawrence Cohen. "The bias smith tube: Simultaneous optimization of bias voltage and load impedance in power amplifier design." Radio and Wireless Symposium (RWS), IEEE. 24-27 Jan. 2016. http://ieeexplore.ieee.org/document/7444408/
4. Charles Baylis; Matthew Fellows; Matthew Flachsbart; Jennifer Barlow; Joseph Barkate; Robert J. Marks. "Enabling the Internet of Things: Reconfigurable power amplifier techniques using intelligent algorithms and the smith tube". 2014 IEEE Dallas Circuits and Systems Conference (DCAS). http://ieeexplore.ieee.org/document/6965341/
Comment settings
All the existing comments will be deleted.
David Whiteman